
Case Study · 3D Modeling
Photogrammetry Ground Truth for the Hamlin Town Center Aerial Capture in Winter Garden, FL
A textured 3D mesh, orthomosaic, and point cloud delivered to d3 Creative Studio for an interactive Unreal Engine 5 sales experience. Two-zone flight across 2,161 acres, with high-resolution coverage of the Highway 429 corridor and retail frontages the developer needed to feature.
The Project
d3 Creative Studio is a 3D visualization studio based in Babcock Ranch, Florida, working with developers and architects across the state on renderings, animations, virtual tours, and interactive experiences. For this engagement, d3 was building an interactive Unreal Engine 5 experience for a developer's sales center at the Hamlin Town Center in Winter Garden, FL.
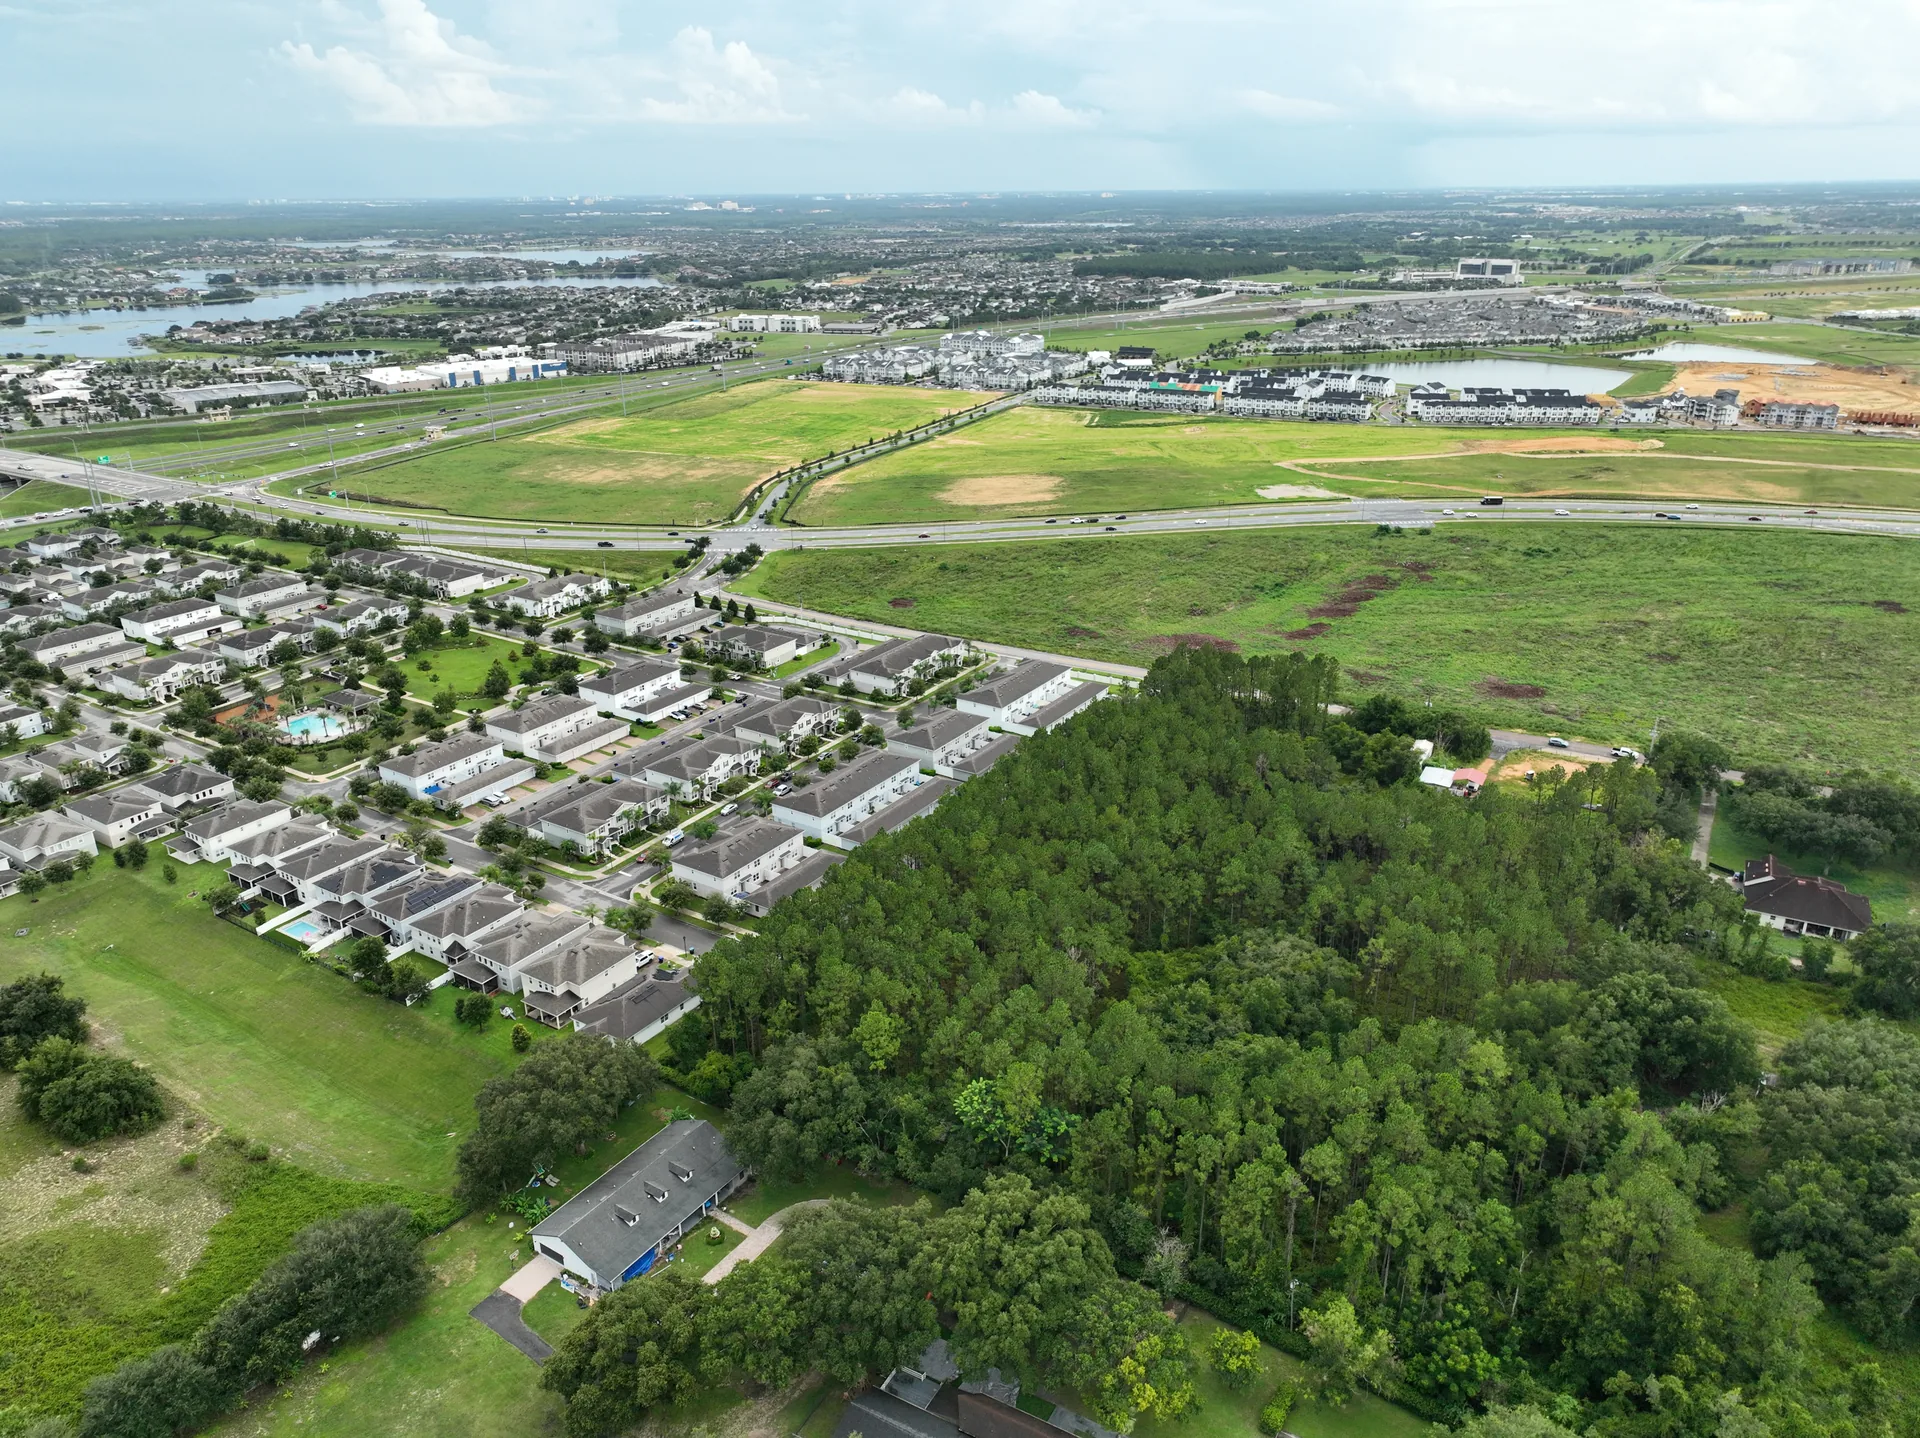
The Hamlin Town Center sits at 14422 Shoreside Way, Winter Garden, FL 34787, directly off State Road 429 and New Independence Parkway, just minutes north of Walt Disney World. The site is part of the Horizon West master-planned community in southwest Orange County and includes the town center, residential apartments and townhomes, retail frontages, a Walmart-anchored shopping area, and the surrounding roadway network. The experience needed source photogrammetry that could be imported into UE5 and used as the ground truth for hotspot-driven viewpoint rendering. Outside the captured polygon, the d3 team planned to stitch open photogrammetry for the horizon view, so the perimeter of our capture had to be geometrically clean where the two datasets met.
The deliverable was not for a static website render. It was for an interactive experience where a prospect would tap a hotspot on the photogrammetry, see retailer signage from that viewpoint, and read the result convincingly. Texture quality and geometry had to hold up at conversation distance, not billboard distance. That was the bar from the first call. d3's own description of the work, from their website, applies here: they create interactive presentations to "show prospective customers, investors, and other stakeholders exactly what they can expect."
The Brief
The capture had to cover the Highway 429 corridor through the site, the adjacent retail frontages, and the residential neighborhoods visible from the highway. Outside the captured area, the d3 team planned to stitch open photogrammetry for the horizon view, so the boundary of our capture had to read as seamless when the two datasets met.
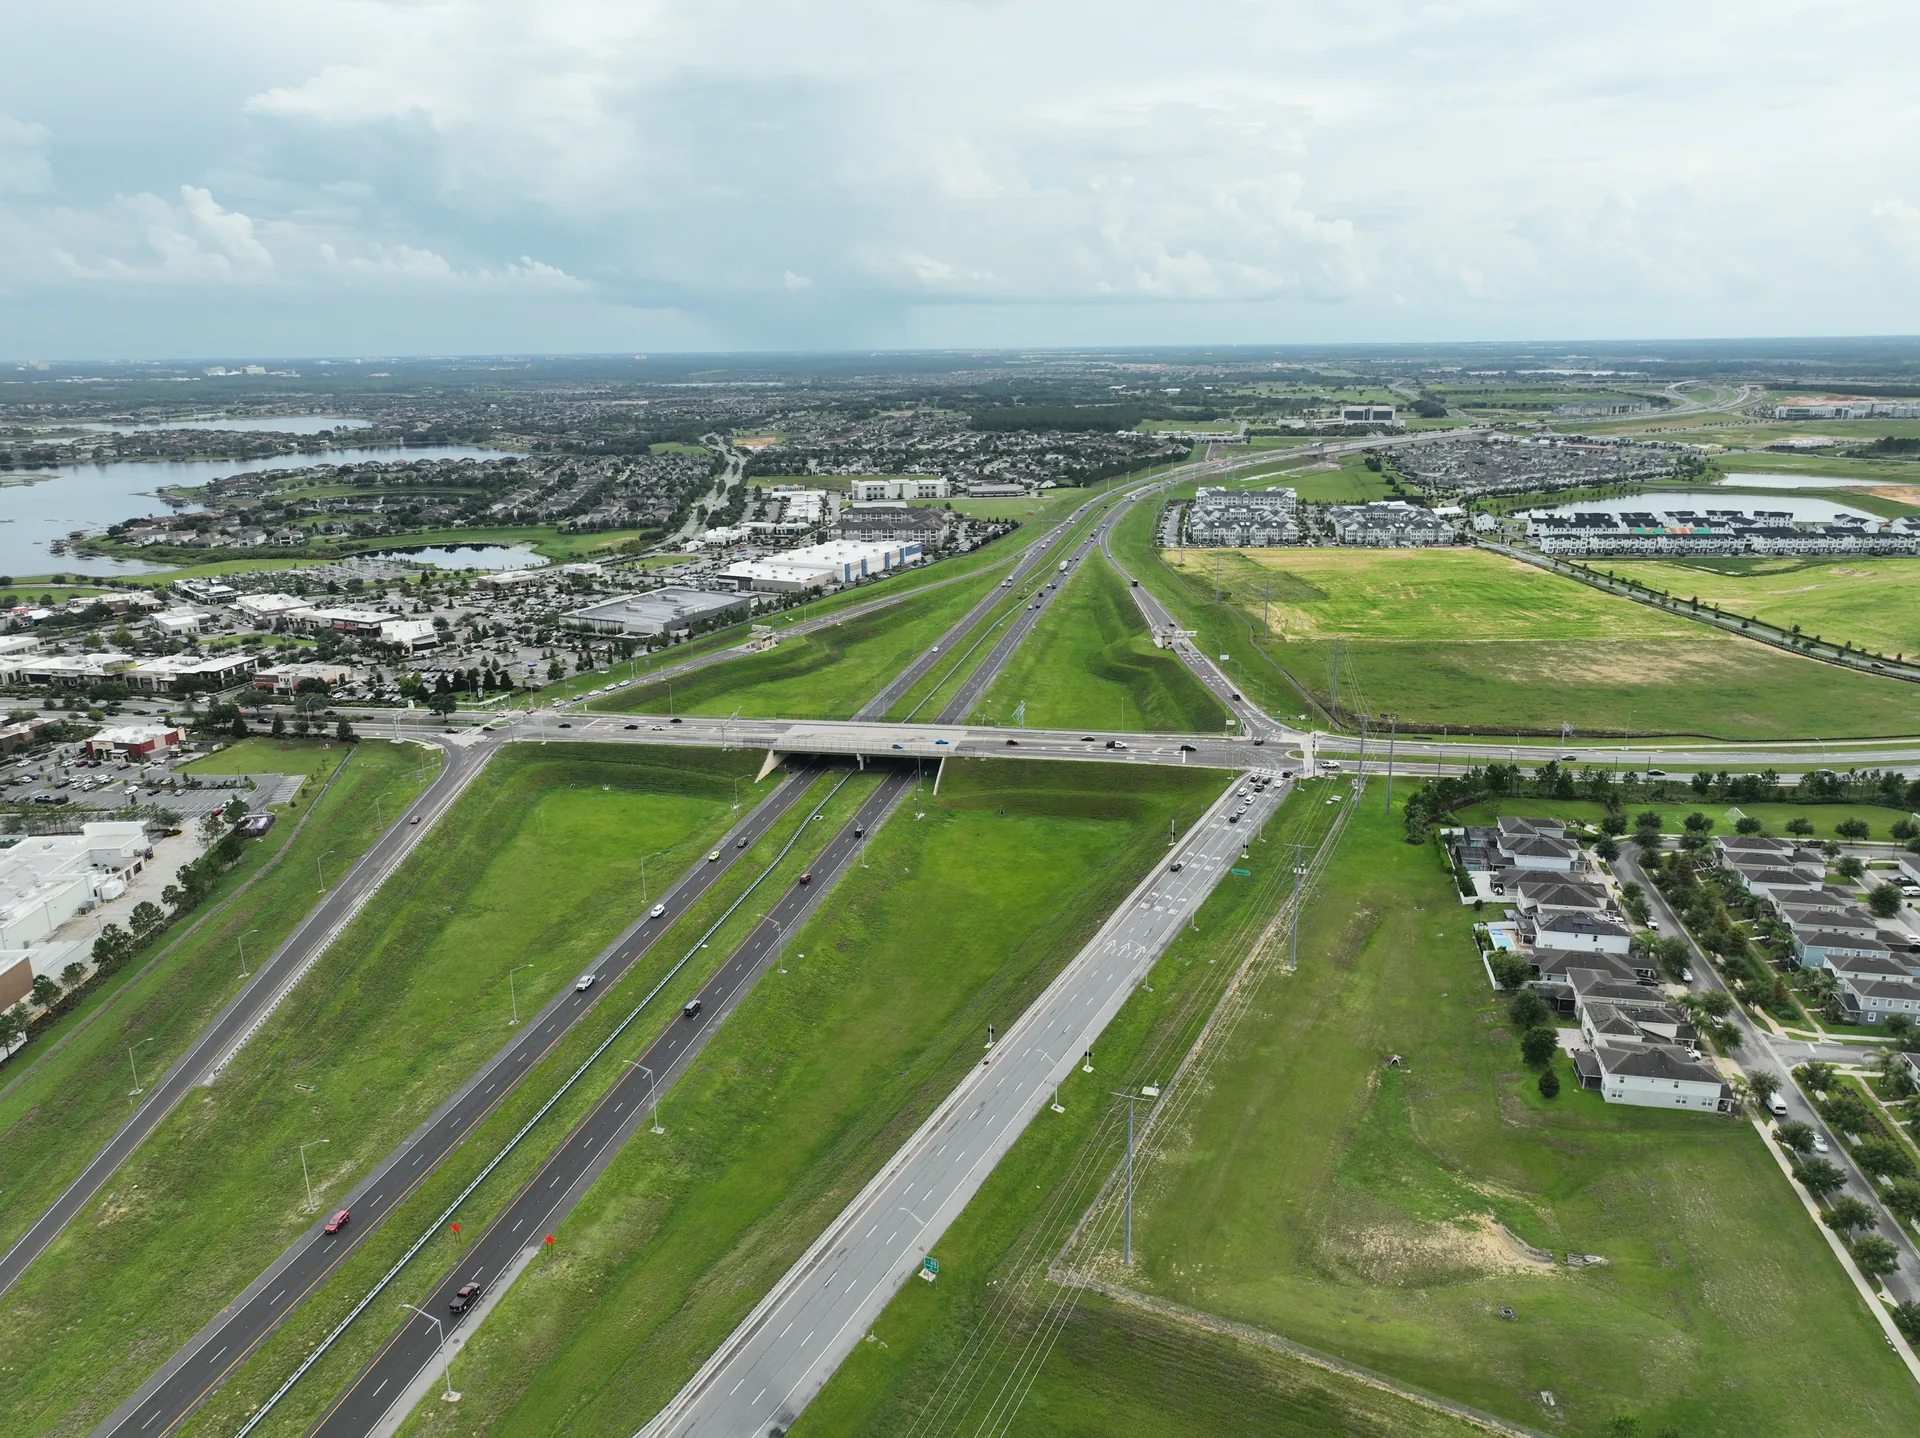
Highway 429 and the surrounding corridor. The combination of interchange, retail, and adjacent residential is the area the developer wanted featured in the interactive experience.
The Area
Horizon West is a master-planned community in southwest Orange County, Florida, covering roughly 20,700 acres across five mixed-use villages and a town center, surrounded by designated greenbelts. The concept was adopted in 1995, and the area is the fastest-growing community in unincorporated Orange County, with a population that grew from 14,000 at the 2010 census to 58,101 at the 2020 census. State Road 429 runs through the area as the main spine for residential growth, retail frontage, and the supporting infrastructure that connects new development to the rest of the Orlando metro.
Active construction is ongoing across multiple villages. New residential phases break ground on a regular cadence, retail and commercial frontages expand as households move in, and the supporting road and utility work happens in parallel. In 2026, Phase 1A of the Horizon West Regional Park opened with new parking, facilities, an event pavilion, and an inclusive playground. For a developer or creative studio planning an interactive sales experience, a stakeholder presentation, or a marketing launch for a community in this area, the photogrammetry capture has to happen while the site is in motion, not after it is finished. The 2,161-acre scope we captured for this project is one of the larger photogrammetry captures in a master-planned setting in the state, and it is the kind of scope that pays for itself when the photogrammetry is shipped to the right downstream pipeline.
Sources: Orange County Government, Horizon West Planning Area · Wikipedia, Horizon West, Florida.
The Approach
The flight plan was two-zone. High-resolution coverage at 150 feet AGL over the roads, bridges, buildings, and retail frontages nearest Highway 429. Medium-resolution coverage at 300 feet AGL over the outer ring where the geometry was being used for context and orientation, not for hotspot viewpoints. The center of the site was omitted entirely. That area was set to be full CGI in the final experience, so flight time and processing power were focused on the parts the photogrammetry actually needed to cover.
Two days of flying produced 45,438 calibrated photos across 16+ hours of total flight time. The dataset was processed in 4-5 days into a tiled 3D model, an orthomosaic, and a point cloud, all geometrically aligned to the same coordinate system so they could be used together or independently downstream. Native ground sample distance came in at roughly 2.9 cm per pixel across the captured area, well within the resolution needed for retail signage and architectural detail to read convincingly from conversation distance.
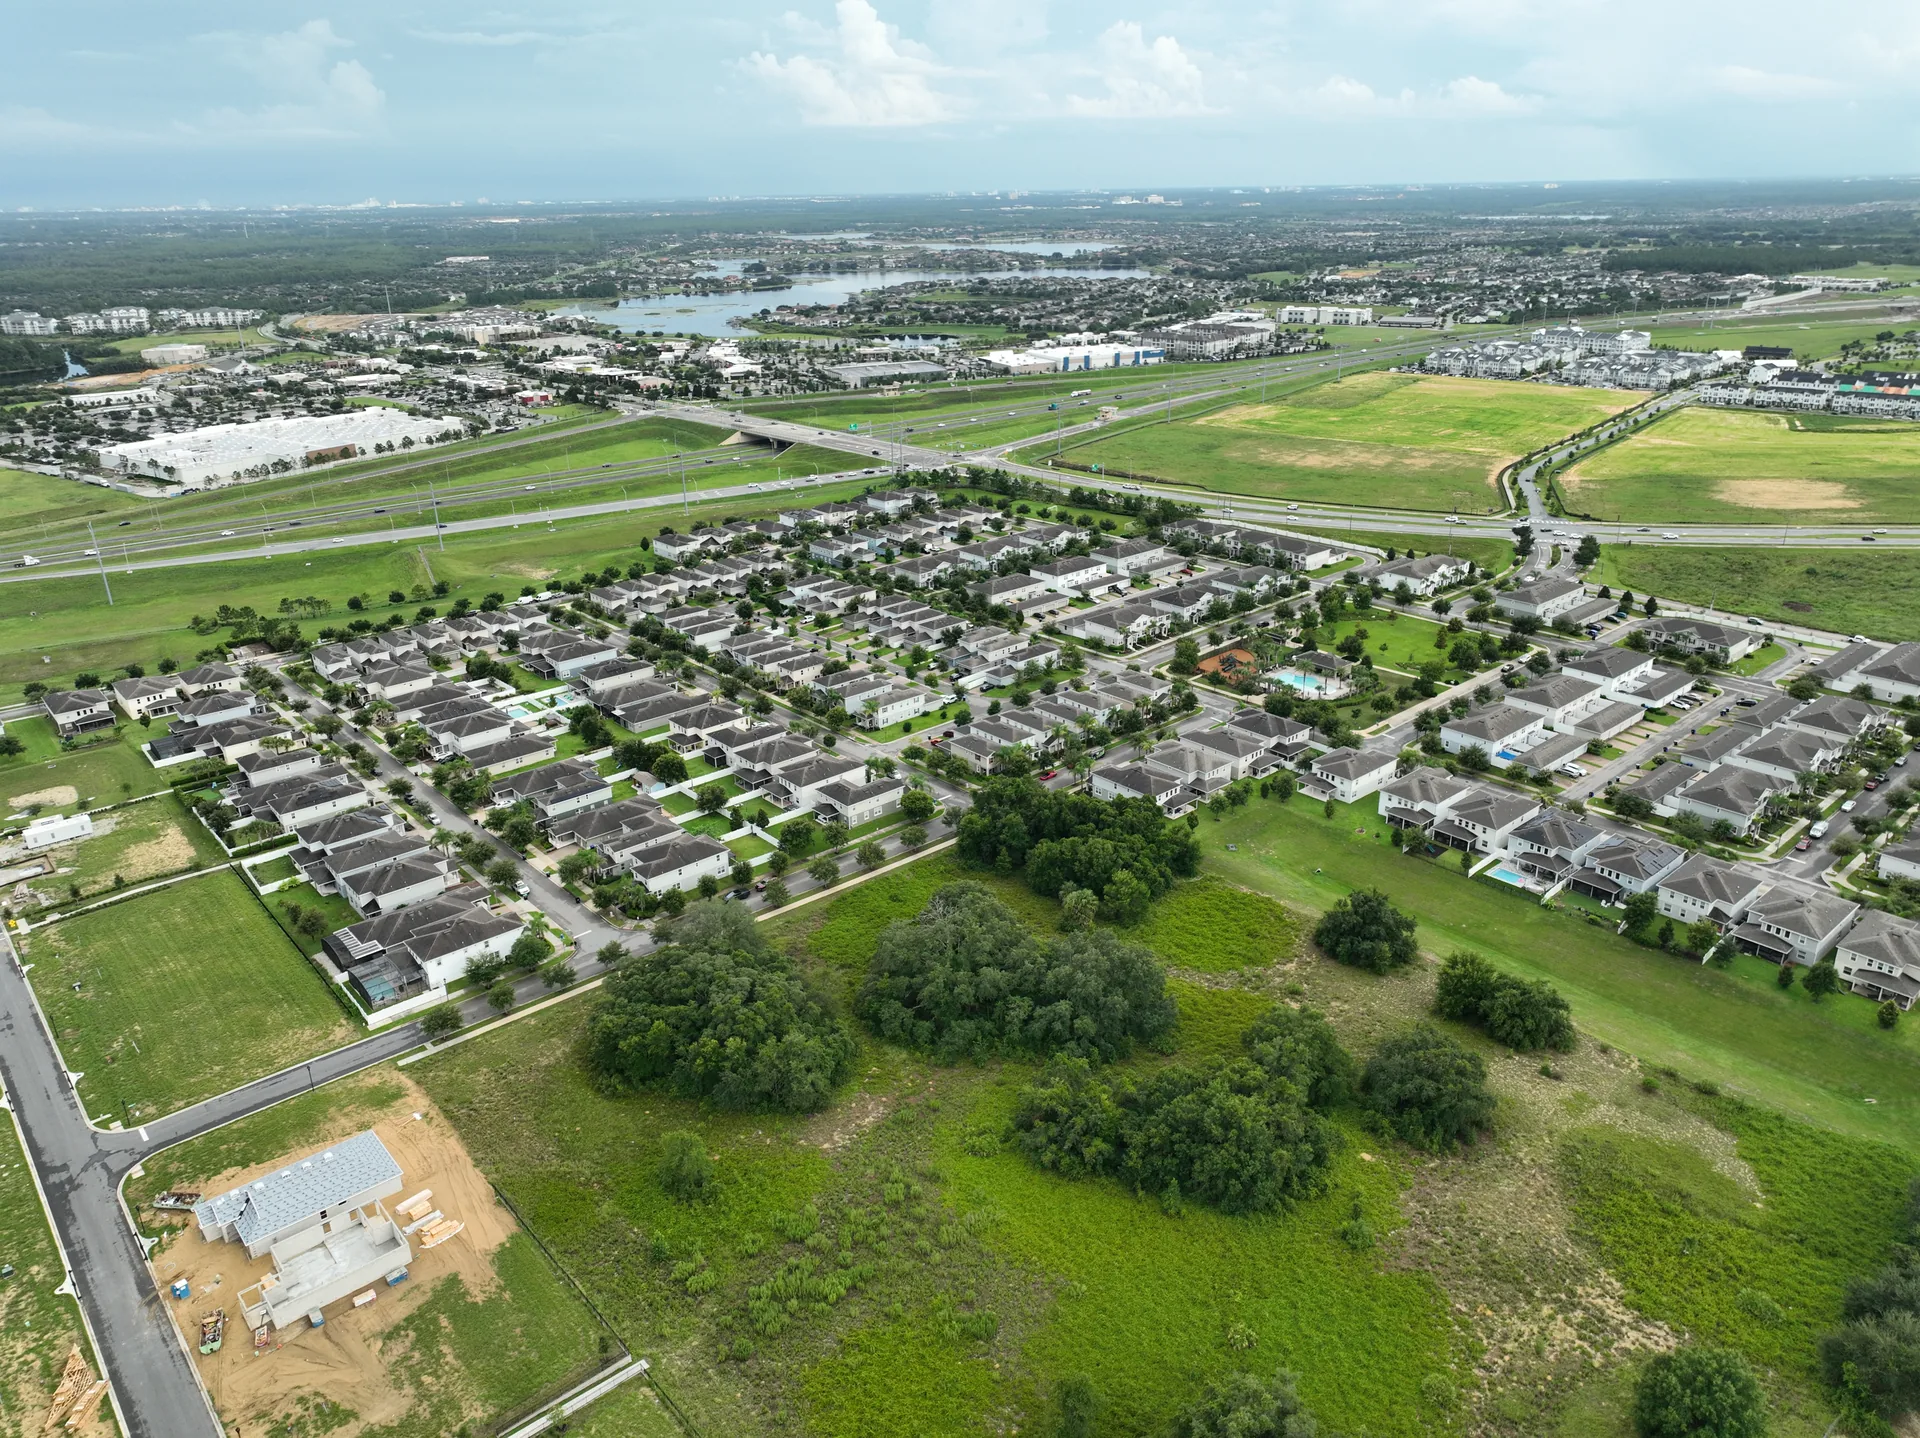
One of the active construction zones inside the site at the time of the flight. Capturing during active development gave the interactive experience a realistic current-state representation.
See the Capture
A flythrough of the photogrammetry point cloud as it sits in the browser-based viewer. The geometry, the textures, and the road network are the same data the d3 team imported into Unreal Engine 5. Tap or click play to load the video.
The point cloud rendered in the private browser viewer, captured at mid-arc. The d3 team used this same dataset in UE5.
The Deliverable
The full dataset, delivered in the formats the d3 team needed for Unreal Engine 5 and any secondary uses they might pursue. A textured 3D mesh, an orthomosaic, and a point cloud, all hosted on a private browser-based viewer for stakeholder access across the project team.
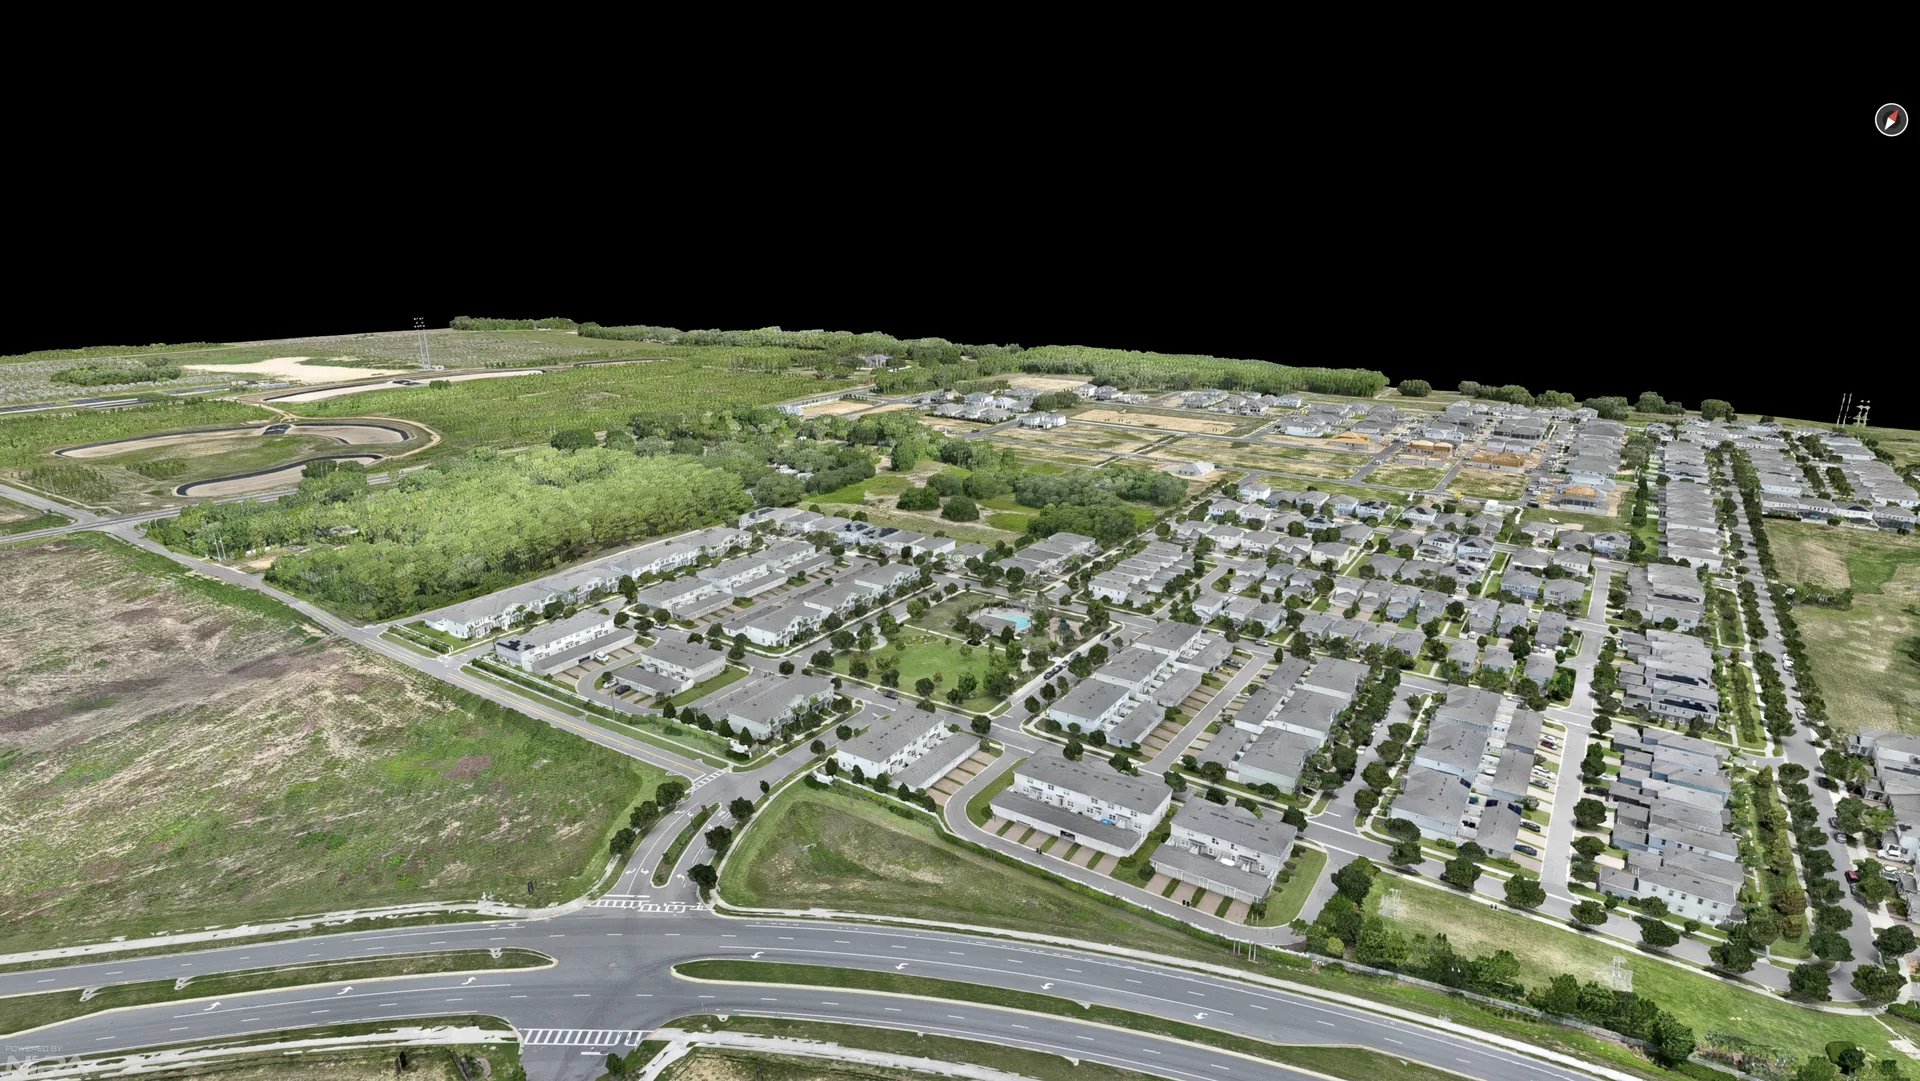
The same site, in the photogrammetry viewer. The geometry, the textures, and the road network are all directly usable in UE5.
Textured 3D Mesh
FBX with textures as the primary deliverable, plus OBJ and MTL with auto-generated texture maps. The mesh was imported directly into Unreal Engine 5 without additional cleanup.
Orthomosaic
Geometrically corrected, flat top-down image of the full site. Used as the base map for any 2D presentation needs and as a reference layer in the 3D pipeline.
Point Cloud
Dense point cloud of the captured area. Useful for additional measurement, for additional modeling in another pipeline, and for any quantitative analysis the developer team wanted to run.
Private Browser Viewer
The full model hosted on a private viewer for stakeholder access. Anyone on the project team can orbit, zoom, and pull measurements without specialized software or a multi-gigabyte download.
The Outcome
Delivered Inside the Deadline
The developer had a hard deadline tied to the lease signing and the sales center opening on August 21, 2026. The full dataset was captured, processed, and delivered with runway to spare for the d3 team to build the interactive experience on top.
Geometry That Imported Cleanly
The FBX and OBJ files were usable in Unreal Engine 5 without additional cleanup. The orthomosaic and point cloud were also delivered for any secondary uses the team decided to pursue. Anthony DeBono (Founder) and Sebastien Leduc (Partner) led the project at d3; their teammate Logan worked with the delivered data on the UE5 build.
A Sales Tool Before Anyone Set Foot on Site
The interactive experience means a prospect can stand on a virtual Highway 429 overpass, tap a hotspot, and see what the retailer signage would look like from that specific viewpoint. That is the actual job the photogrammetry was hired to do, and d3 delivered it without ever needing the developer to host a physical tour of a not-yet-built site.
Project Credit
Aerial capture and processing by Skyland Pixels. Interactive experience design and Unreal Engine 5 build by d3 Creative Studio (Babcock Ranch, Florida).
Volumetric Capability
The same aerial capture methodology that produced this photogrammetry model also feeds volumetric stockpile calculations and earthwork quantity surveys. Cut and fill volumes, stockpile tonnage, and material quantities are computed directly from the dense point cloud. No extra ground survey required. The workflow below shows the output of a stockpile volume calculation generated from an aerial photogrammetry capture using the same processing pipeline that produced the Hamlin dataset.
A stockpile volume calculation rendered from an aerial photogrammetry capture. The mesh and the cut/fill surface are both derived from the same point cloud; the volumetric quantity is computed from the difference between them.
Stockpile Quantities
Cubic yards and tonnage for aggregate, soil, and material piles from a single aerial flight. Useful for site balance, contractor billing, and material tracking.
Cut and Fill Analysis
Earthwork quantity surveys from before-and-after flights. Volume of cut needed, volume of fill needed, and net import/export quantities.
Same Aerial Capture
No additional ground survey required. The volumetric calculation comes from the same dense point cloud that produces the visual photogrammetry model.
Related Services
A photogrammetry capture for an interactive 3D experience is one of the deliverables under our 3D modeling pillar. Most creative studios and developers engage us on more than one of these for a single project.
Aerial Photogrammetry
Textured 3D meshes, orthomosaics, and point clouds for sales center experiences, marketing, and ground-truth source data for downstream visualization.
Orthophoto Mapping
Geometrically corrected full-site orthomosaics for sales center displays, wayfinding directories, planning basemaps, and stakeholder presentations.
Volumetric Calculations
Cut and fill volumes, stockpile tonnage, and earthwork quantities from the same aerial capture. Useful for site balance, contractor billing, and material tracking.
Frequently Asked Questions
What is photogrammetry used for in commercial development projects?
Aerial photogrammetry turns a series of overlapping aerial photos into a textured 3D model, an orthomosaic, and a point cloud of the captured area. For commercial development projects, the most common uses are interactive sales center experiences, marketing imagery, master planning basemaps, construction progress documentation, and ground-truth source data for downstream visualizations built in Unreal Engine, Unity, or arch-viz pipelines.
How does open-source photogrammetry stitching work with edge capture?
For large-scale projects, the captured area is often only part of the final experience. The creative team can stitch open or lower-resolution photogrammetry models in for the horizon view beyond the captured area. The edge of the high-resolution capture has to be geometrically clean so the two datasets blend without a visible seam. That is why the flight plan, the altitude selection, and the photo overlap matter at the perimeter of the capture, not just in the middle.
Why deliver the model in a browser-based viewer instead of raw files?
A textured 3D mesh of a multi-thousand-acre site can easily reach 10 GB or more. Sending that as a download means the recipient needs specialized software, the disk space to hold it, and the time to open it. A browser-based viewer lets any stakeholder on the project team orbit the model, zoom to a specific feature, and pull measurements without installing anything. The raw files are still available for the team that needs them; the viewer is for everyone else.
What is the difference between a visual-quality photogrammetry model and a survey-grade one?
A visual-quality photogrammetry model is optimized for texture fidelity and visual representation at the viewing distances the final experience will use. A survey-grade model is optimized for geometric accuracy to a stated tolerance, typically with ground control points surveyed by a licensed surveyor. Visual-quality is the right choice for sales center experiences, marketing, and stakeholder presentations. Survey-grade is the right choice for engineering, boundary determination, and design-grade elevation work. They are different deliverables with different costs, equipment, and turnarounds.
How long does a 2,000+ acre photogrammetry project take from booking to delivery?
It depends on the scope, the site, the time of year, and the processing pipeline. The d3 Creative Studio project we shipped for Hamlin / Horizon West was a 2,161-acre capture that flew in two days (16+ hours of total flight time, 45,438 calibrated photos), processed in 4-5 days into a tiled 3D model, orthomosaic, and point cloud, and delivered to the d3 team ahead of the developer deadline of August 21, 2026. For a comparable scope, on-site capture is typically 1-3 days of flying plus preflight planning. Processing time depends on the dataset size, the desired output quality, and the processing pipeline. We confirm timelines scope-by-scope before booking.
Can the same aerial capture produce both a 3D model and a volume calculation?
Yes. The dense point cloud that produces the visual photogrammetry model is the same data source for stockpile volume calculations, cut/fill analysis, and earthwork quantity surveys. No additional ground survey is required for the volumetric output. The volume comes from the difference between the captured surface and a reference plane (for stockpiles) or between before-and-after surfaces (for cut/fill). The processing pipeline produces both deliverables from one flight.
Planning a Capture Like This?
Tell us about your site and the use case. We will confirm fit, recommend a flight plan, and provide a quote within 48 hours.
Plan a Capture Like This